Dashboard
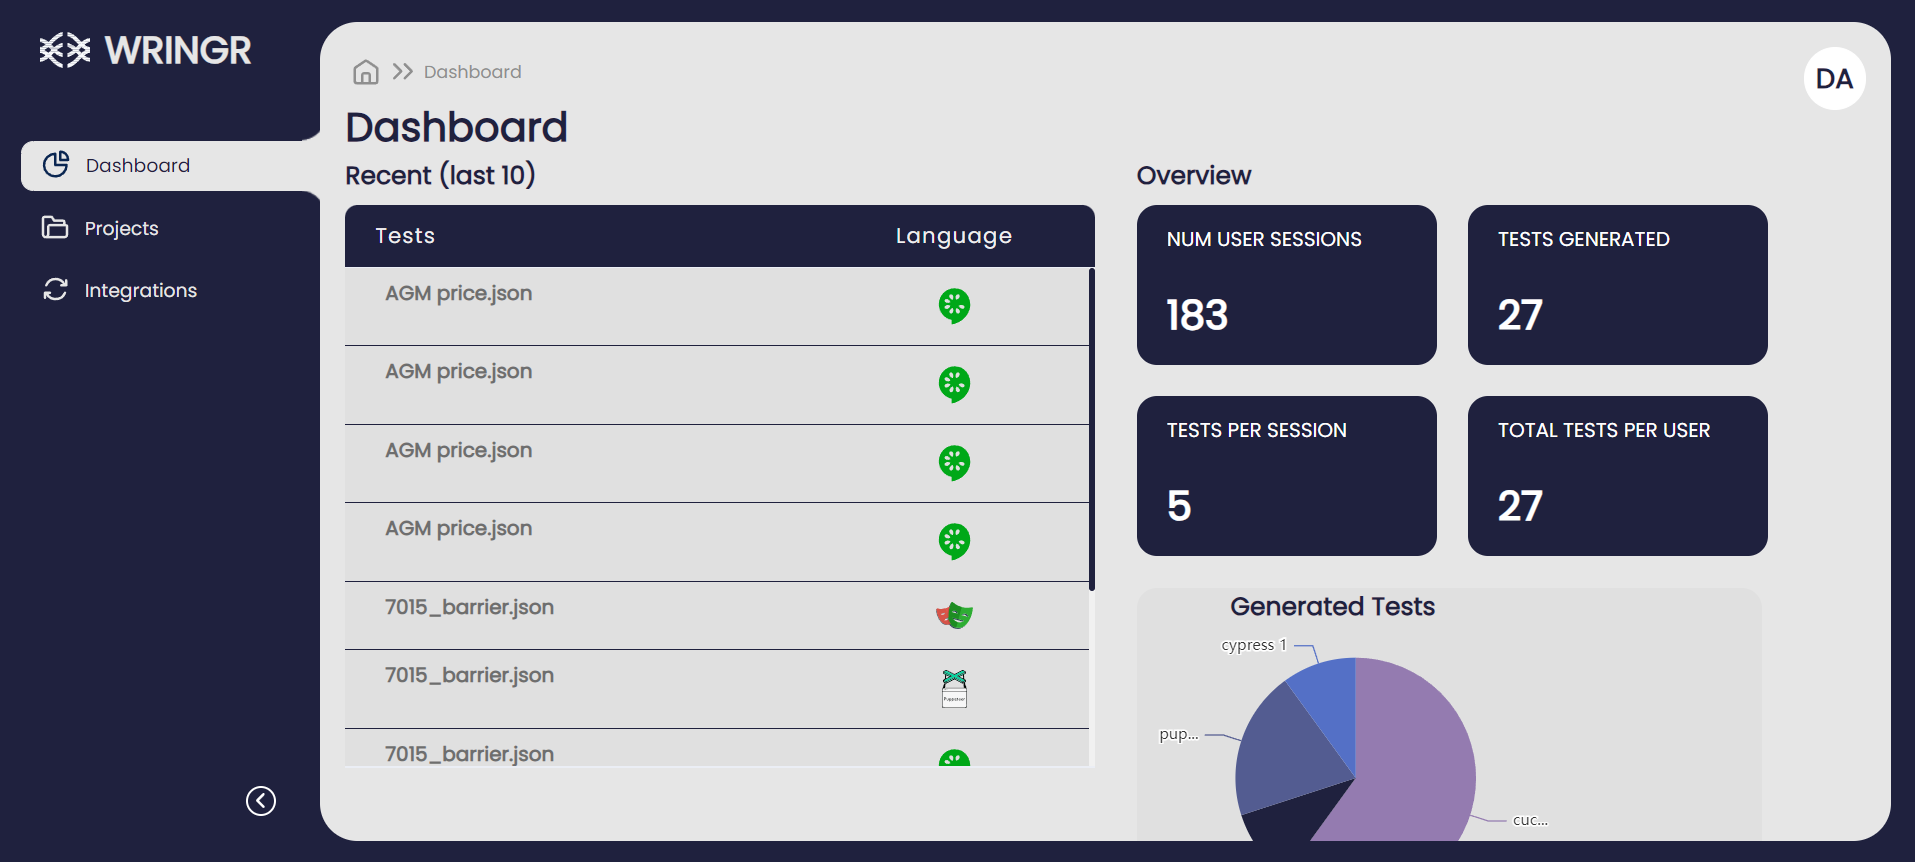
The Dashboard offers a comprehensive overview of your testing activities, presenting key metrics and statistics to help you monitor and manage your test executions effectively. Here's what you can find:
- User Sessions: Displays the total number of user sessions recorded in the system.
- Tests Generated: Shows the total number of tests that have been generated.
- Tests Per Session: Indicates the average number of tests generated per session.
- Tests Per User: Displays the average number of tests per user.
Recent Tests for All Users
- Tests: A list of recent tests conducted by all users. You can view the test names here.
- Status: Indicates the current status of each test, whether it passed or failed.
Generated Tests Complexity
- Pie Chart: Visual representation of the complexity of generated tests. It categorizes tests into three levels: easy, medium, and hard.
- Easy: Number of easy tests generated.
- Medium: Number of medium complexity tests.
- Hard: Number of hard tests generated.
Avg Time to Generate Test
- Time Display: Shows the average time taken to generate a test.
This dashboard is designed to give you quick insights into your testing activities, enabling you to assess the overall effectiveness of your test generation and execution processes.
The right-side panel in the Wringr Dashboard provides quick access to account management options and settings.
1. My Profile
- Option: Click on "My profile" to view and edit your account details, such as your username, email, and other personal information.
2. Subscription Plans
- Option: Click on "Subscription Plans" to view and manage your subscription. Here you can upgrade, downgrade, or renew your plan based on your needs.
3. Documentation
- Option: Selecting "Documentation" will redirect you to the help and support documentation. This section contains detailed guides and FAQs on using Wringr's features.
4. Report a Bug
- Option: If you encounter any issues or bugs while using Wringr, click on "Report a Bug" to submit feedback to the support team. This helps improve the platform.
5. Language Selection
- Dropdown: The "Language" dropdown allows you to select the language in which the Wringr interface is displayed.
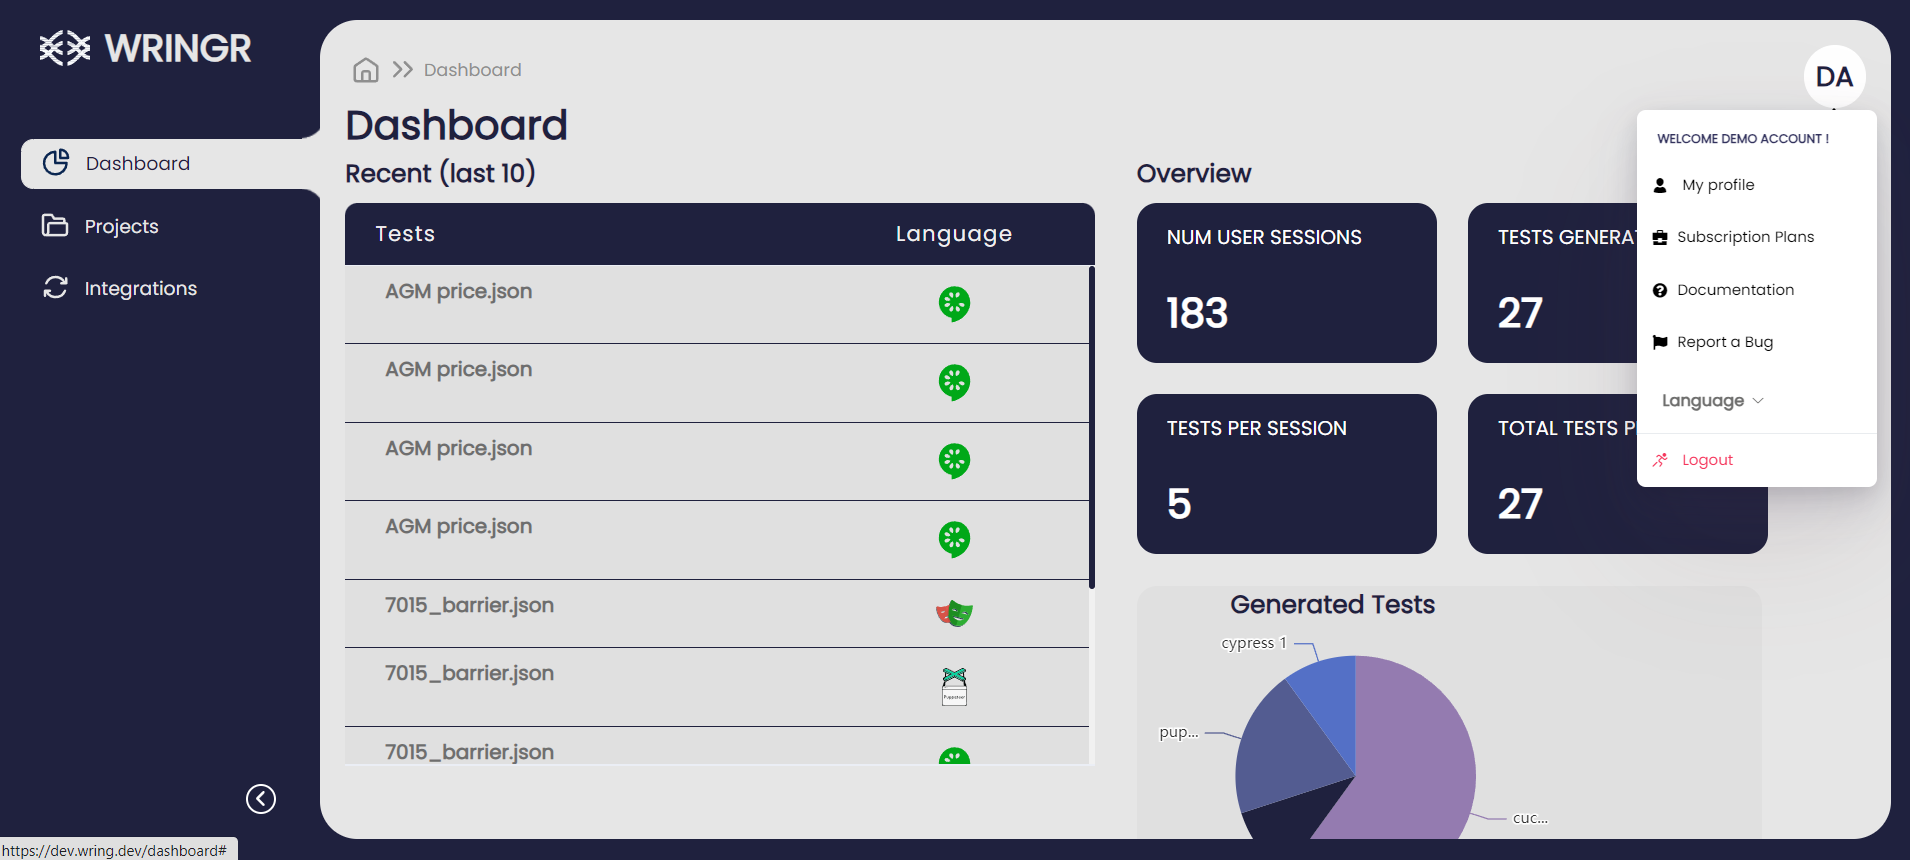
By using this panel, you can efficiently manage your account settings, access help documentation, report issues, and adjust language preferences to ensure the best user experience on the Wringr platform.
Congratulations!
You have now explored some of the basic features in the Wringr AI, and how to use them. Now you are ready to explore a few advanced features and get to know how they work.
Remember, if at any point you want to reference the documentation, the link is one click away from the AI!